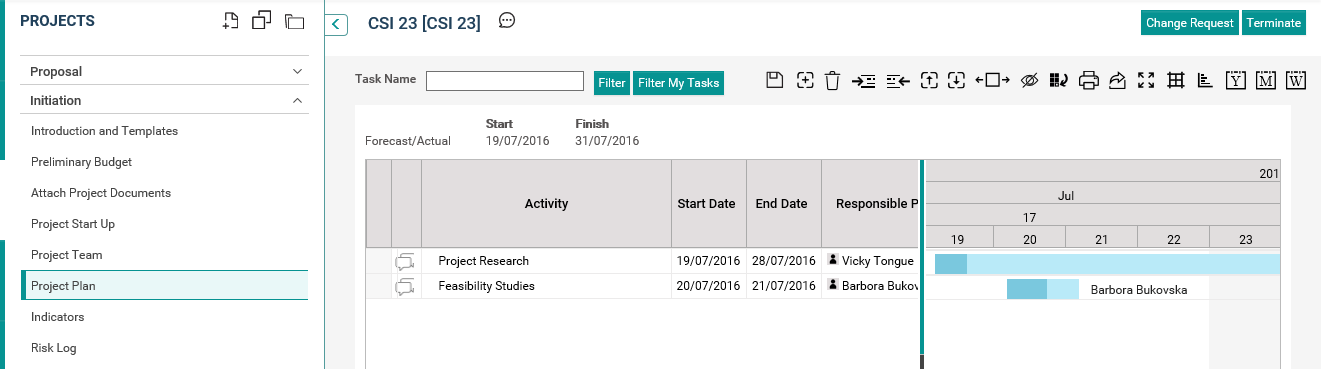
This object facilitates you to create tasks for a given project and display them in a graphical timescale format in a Gantt chart. The fields configured in the Object Editor area are displayed as shown in the below screenshot:
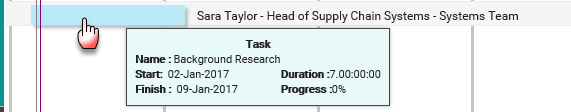
Hover over any of the coloured bars to view a quick summary.
Any changes done to the Project Table will be automatically updated in the Gantt chart in real-time and vice versa. Once a Summary Task is completed, all of its Child Tasks are auto updated and vice versa as well.
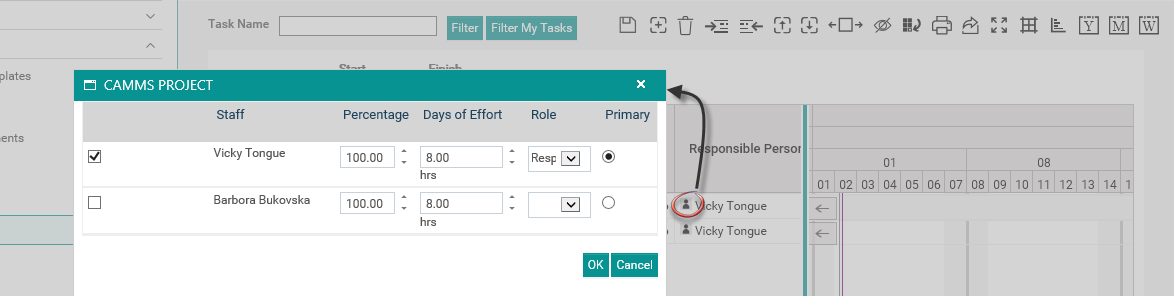
You can assign multiple resources to a task by clicking on the icon on 'Responsible Person' column. You need to tick the staff which you need to allocate as resources and click 'OK'. You have to decide the primary resource by ticking the 'Primary' box and this selection is mandatory. You can also see the percentage of involvement through the 'Days of Effort' which will be decided by the user (double click the 'Hours per day' box in order to edit the value'). See the example given below:
The icons above the Gantt chart can be used to add,edit and delete tasks as necessary along with many other functions.
|
Icon |
Description |
|
|
Saves Gantt chart. |
|
|
Prints Gantt chart information. This provides different options to print. |
|
|
Adds a new task to the Gantt chart. |
|
|
Deletes the selected task from the Gantt chart. |
|
|
Indents / Outdents the selected task. |
|
|
Expands / Collapses the default Gantt chart view to fill the screen. |
|
|
Shows / Hides the critical path within the project schedule |
|
|
Create / View Baseline. |
|
|
Add notes against a Task |
|
|
Downloads the MS Project Addin - which gives the ability to export the Gantt chart as an XML file which can be then viewed and edited using MS Project. Once edited it can also be imported back into CAMMS Projects (IPM). See 'MS Project Addin' section for more information on this function. |
|
|
Export the task planning details to a PDF or export the Gantt Chart as an image. |
|
|
Fits the Gantt chart to show on the page in full. |
You can also switch to following views by clicking on relevant icons:
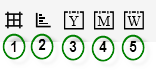
1 - Table View
2 - Chart View
3 - Year View
4 - Month View
5 - Week View
The system uses the following icons to indicate the task progress.
|
Indicator |
Description |
|
|
'On track' This is displayed if the activities of a task are going according to the project schedule. |
|
|
'Monitor' This is displayed if the task needs to be monitored. |
|
|
'Off track' This is displayed if the activities of a task are going behind the project schedule. |
|
|
N\A This is displayed when a new task is created. After task details are entered, this is replaced by any of the above indicators. |
|
|
'No Target Set' This is displayed if a project does not have a target. |
Copyright © 2014-2015 CAMMS Online Help. All rights reserved.
Last revised: July 26, 2017


